Open environmental data analysis
12 Jan 2018 | By Daniel NüstThis article is cross-posted in German on the senseBox blog.
It’s the time of the year to make resolutions and to see beyond one’s own nose. For o2r team member Daniel, this meant to explore what he could do with his brand new senseBox:home and the awesome BinderHub instead of putting it on the back burner.
Building on a deep stack of Open Hardware, Free and Open Source Software, and Open Data, he created a fully open analysis of particulate measurements at New Year’s Eve in Münster. With just a few clicks you can open the exact computational environment which he utilized to retrieve historic sensor data from the openSenseMap API, and to analyse and visualise it with R. And all that without installing any software to your computer, all you need is a web browser.
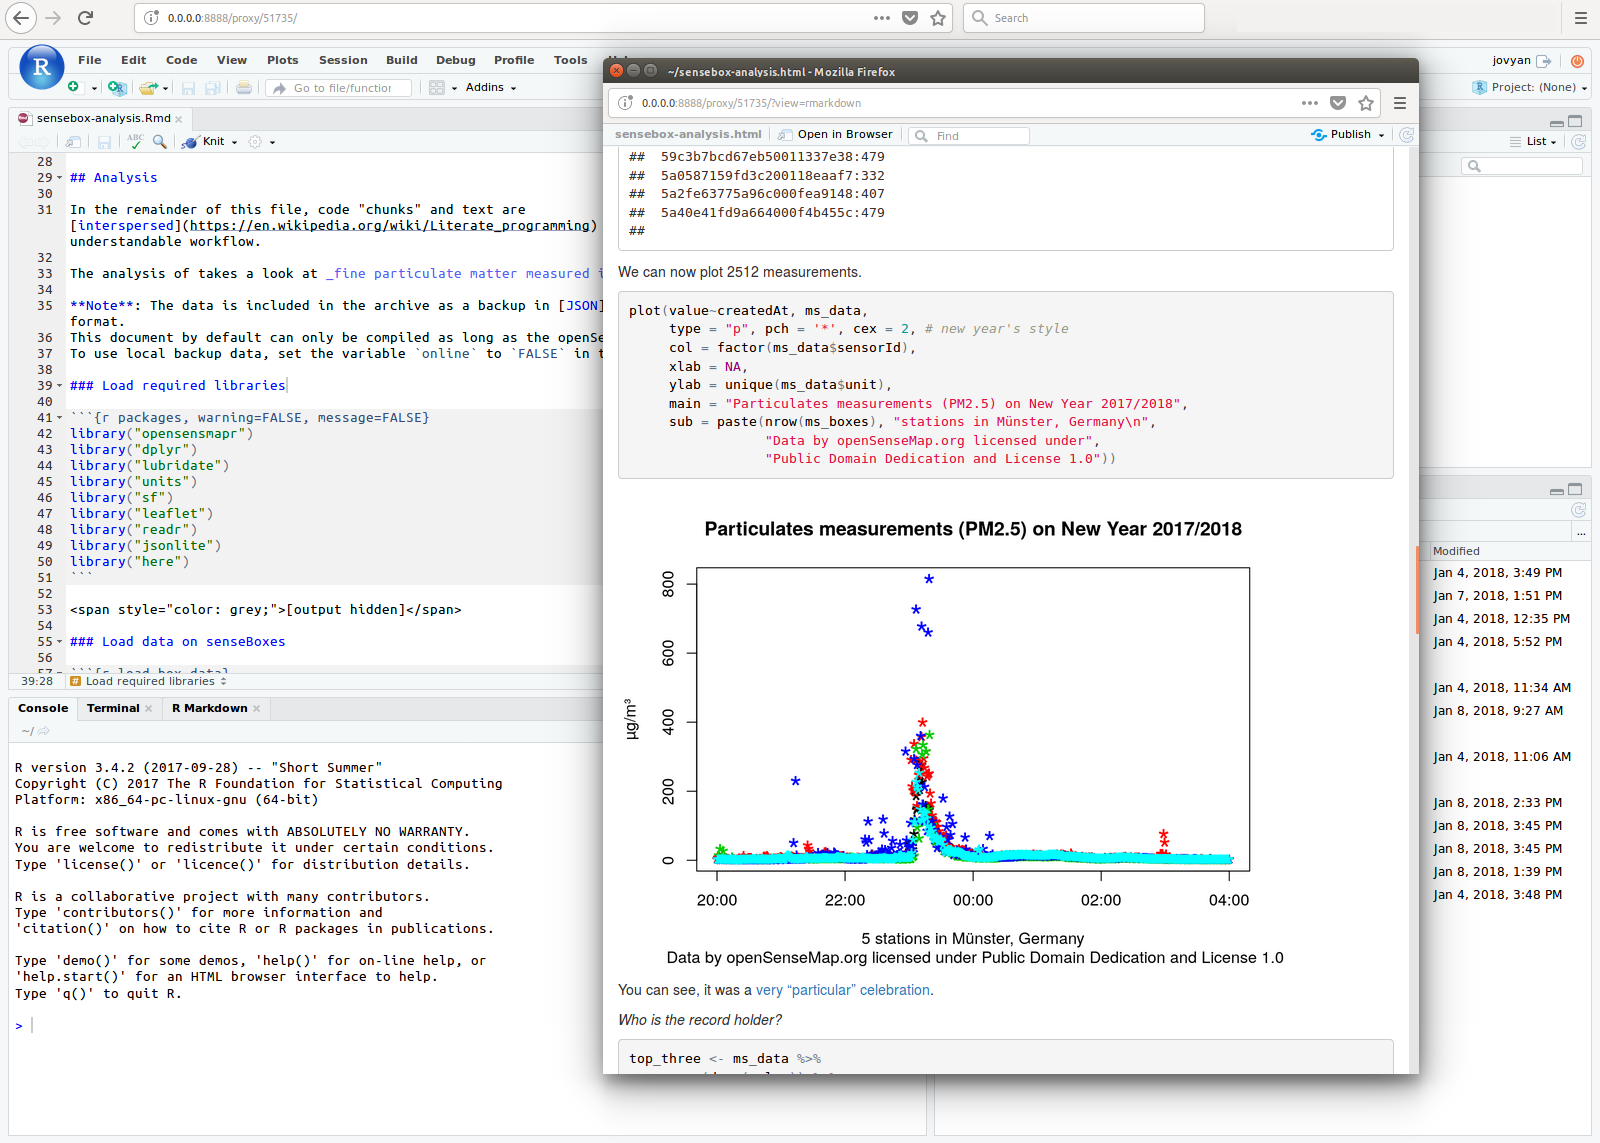
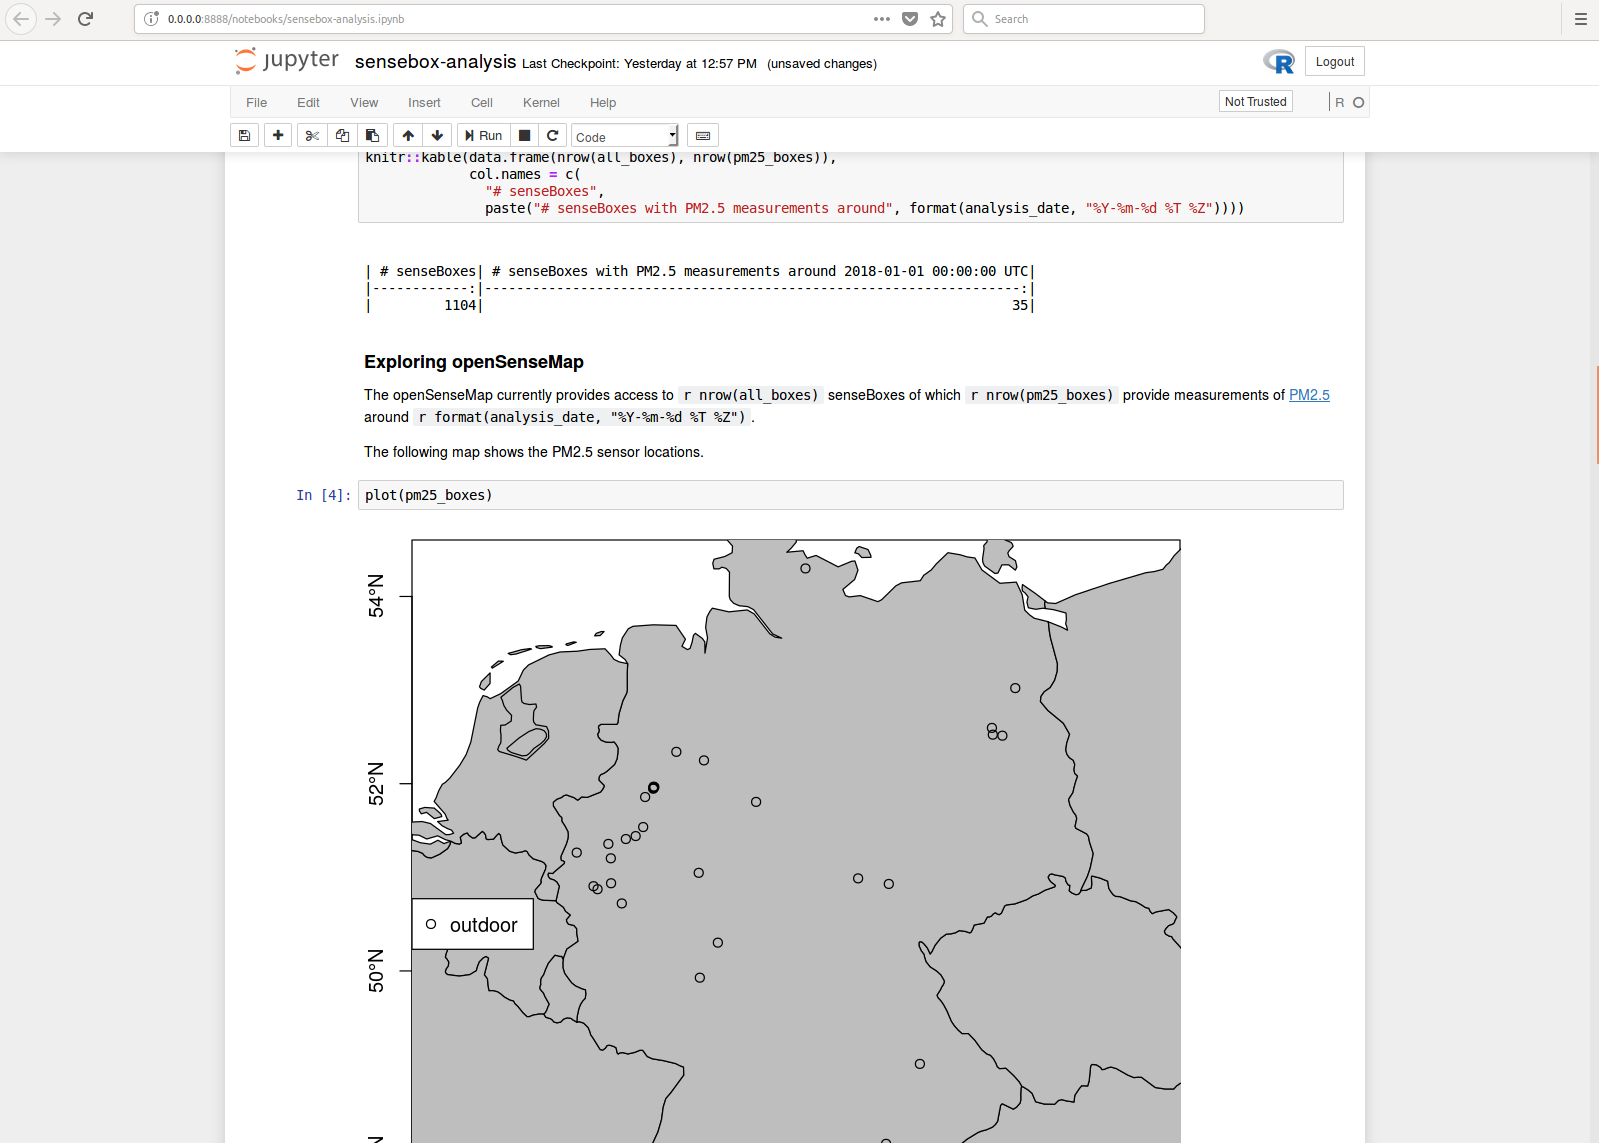
The following screenshots show the RStudio and Jupyter Notebook renderings of the workflow.
And of course he worried about reproducibility and put in several layers of backup! Learn all about it at the GitHub repository:
https://github.com/nuest/sensebox-binder/
Or get a peak at the output of the analysis here: https://nuest.github.io/sensebox-binder/sensebox-analysis.html
And we were not the only ones taking a look at particulate matter in Germany using R. Johannes Friedrich, researcher at University of Bayreuth, used his R package senseBox to download and plot data of over 400 senseBoxes. See his blog for his findings.


