4+1 quick incentives of open reproducible research
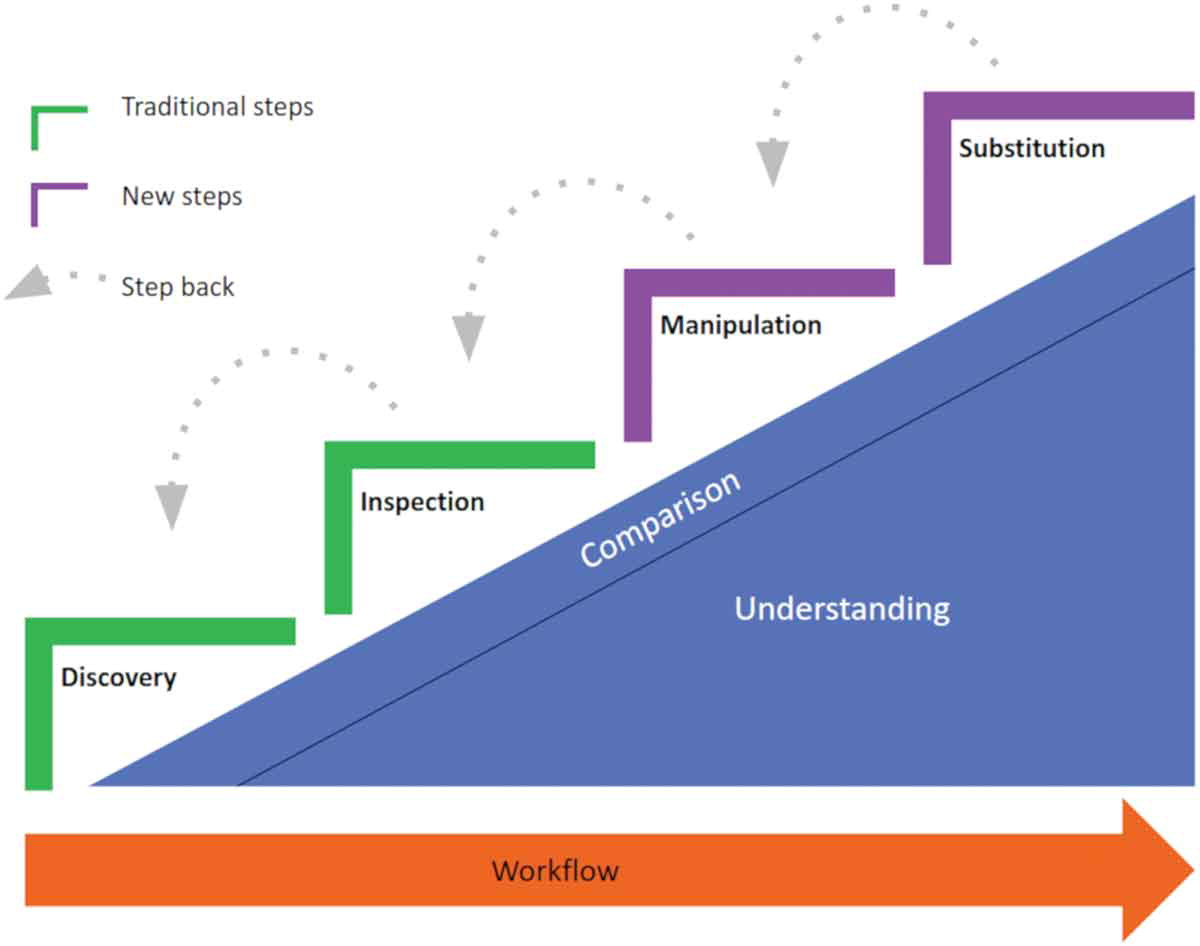
15 Jul 2019 | By Markus KonkolA few months ago, o2r team member Markus published the article “In-depth examination of spatiotemporal figures in open reproducible research” in the journal Cartography and Geographic Information science. Our goal was to identify a set of concrete incentives for authors to publish open reproducible research, and for readers to engage with it. Based on semi-structured interviews, a focus group discussion, and an online survey with geoscientists, we summarised the incentives in a four-step workflow for readers who work with scientific papers (see figure below). Let’s see what these four workflow steps are who their +1 is.
Discovery
By having all materials available in a publicly accessible way, we obtain additional capabilities to search for scientific papers which go beyond today’s keyword-based search engines. The materials underlying a paper include a bunch of information which can be extracted automatically (see o2r-meta) and put on display (see geospatial data science badges) to improve discovery. You were wondering how to use a specific software library in your R code in practice? Just search for papers with computations based on that library. Spatial information, temporal properties, models, parameters - this all becomes searchable which is good for readers, and findable which is good for the impact of authors.
Inspection
Once researchers found a suitable paper, they can continue with inspecting it. Parallel to reading the actual text of the paper, they can inspect the underlying source code and data. This is of particular interest for reviewers who want to check how the authors achieved the results reported in the paper. By the way, more and more reviewers reject papers reporting on computational results that do not contain code or data - Think about it! Again, this step is not only beneficial for readers and reviewers but also for the authors who can make their research workflows more reusable resulting in a higher research impact.
Manipulation
Many results in scientific papers are based on computational analyses. These calculations often include parameters which were set in a specific way by the author of the article. For example, a model that computes the damage costs caused by a flood strongly depends on the flow velocity (see Dottori et al., 2016) of the water. It is difficult to show in static papers, how changes to the flow velocity affect the final damage costs. One idea to solve this issue is an interactive figure. Readers and Reviewers can, for example, use a slider to change the parameter value interactively.
Substitution
Finally, other researchers can substitute, for instance, the original dataset by an own compatible dataset. This opportunity not only makes other researchers’ life easier as they can reuse existing materials, but might also bring citations, co-authorships, and cooperations for the original author.

+1
So who is this workflow steps’ +1?
It’s understanding.
In the paper, we argue that each of the steps contribute to a reader’s understanding in a better way than traditional papers could do. Already during the inspection phase, researchers get to know about spatio-temporal properties, used functions and so on. During inspection, they can see how the authors produced a specific figure, experience the data from the analysts perspective, and finally understand how the authors came to their conclusions. By manipulating parameters, readers and reviewers can comprehend better how the model actually works. Substituting datasets provides insights into the applicability to other settings and evaluates robustness of an approach. A key requirement for the realization of understanding is being able to compare, for example, the original figure with one resulting from parameter manipulation.
You think that this was nice to read but difficult to realize? Correct, it is. And that is why the o2r team works hard to make the five incentives easier to achieve and received funding for two more years.


